Made with by Daniela in San Francisco Bay Area, Califronia.
Verdigris Data Visualization
A data display experiment to meet various requirements
The goal of the lobby dashboard was to be a "flashy" data visualization that would showcase Verdigris' ability to collect and display energy data in real-time, at a very granular level.
- Data Viz +
Challenge
At Verdigris, a key customer and investor had requested an engaging data visualization of building energy that could be shown in their corporate HQ's lobby. The idea of a lobby dashboard had been floating around for a while at Verdigris, and these seemed like an opportune time to invest in building it.
Unlike the web analytics product, the goal of the lobby dashboard was to be a "flashy" data viz that would showcase Verdigris' ability to collect and display energy data in real-time, at a very granular level.
Audience
Business people visiting the lobby of a global manufacturing company’s innovation group
Key Messages
This company is a leader in connected buildings innovations in support of sustainability efforts.
Verdigris is the gateway to this future of connected buildings.
Our approach to this future is to first get complete transparency on building activities and then target problems.
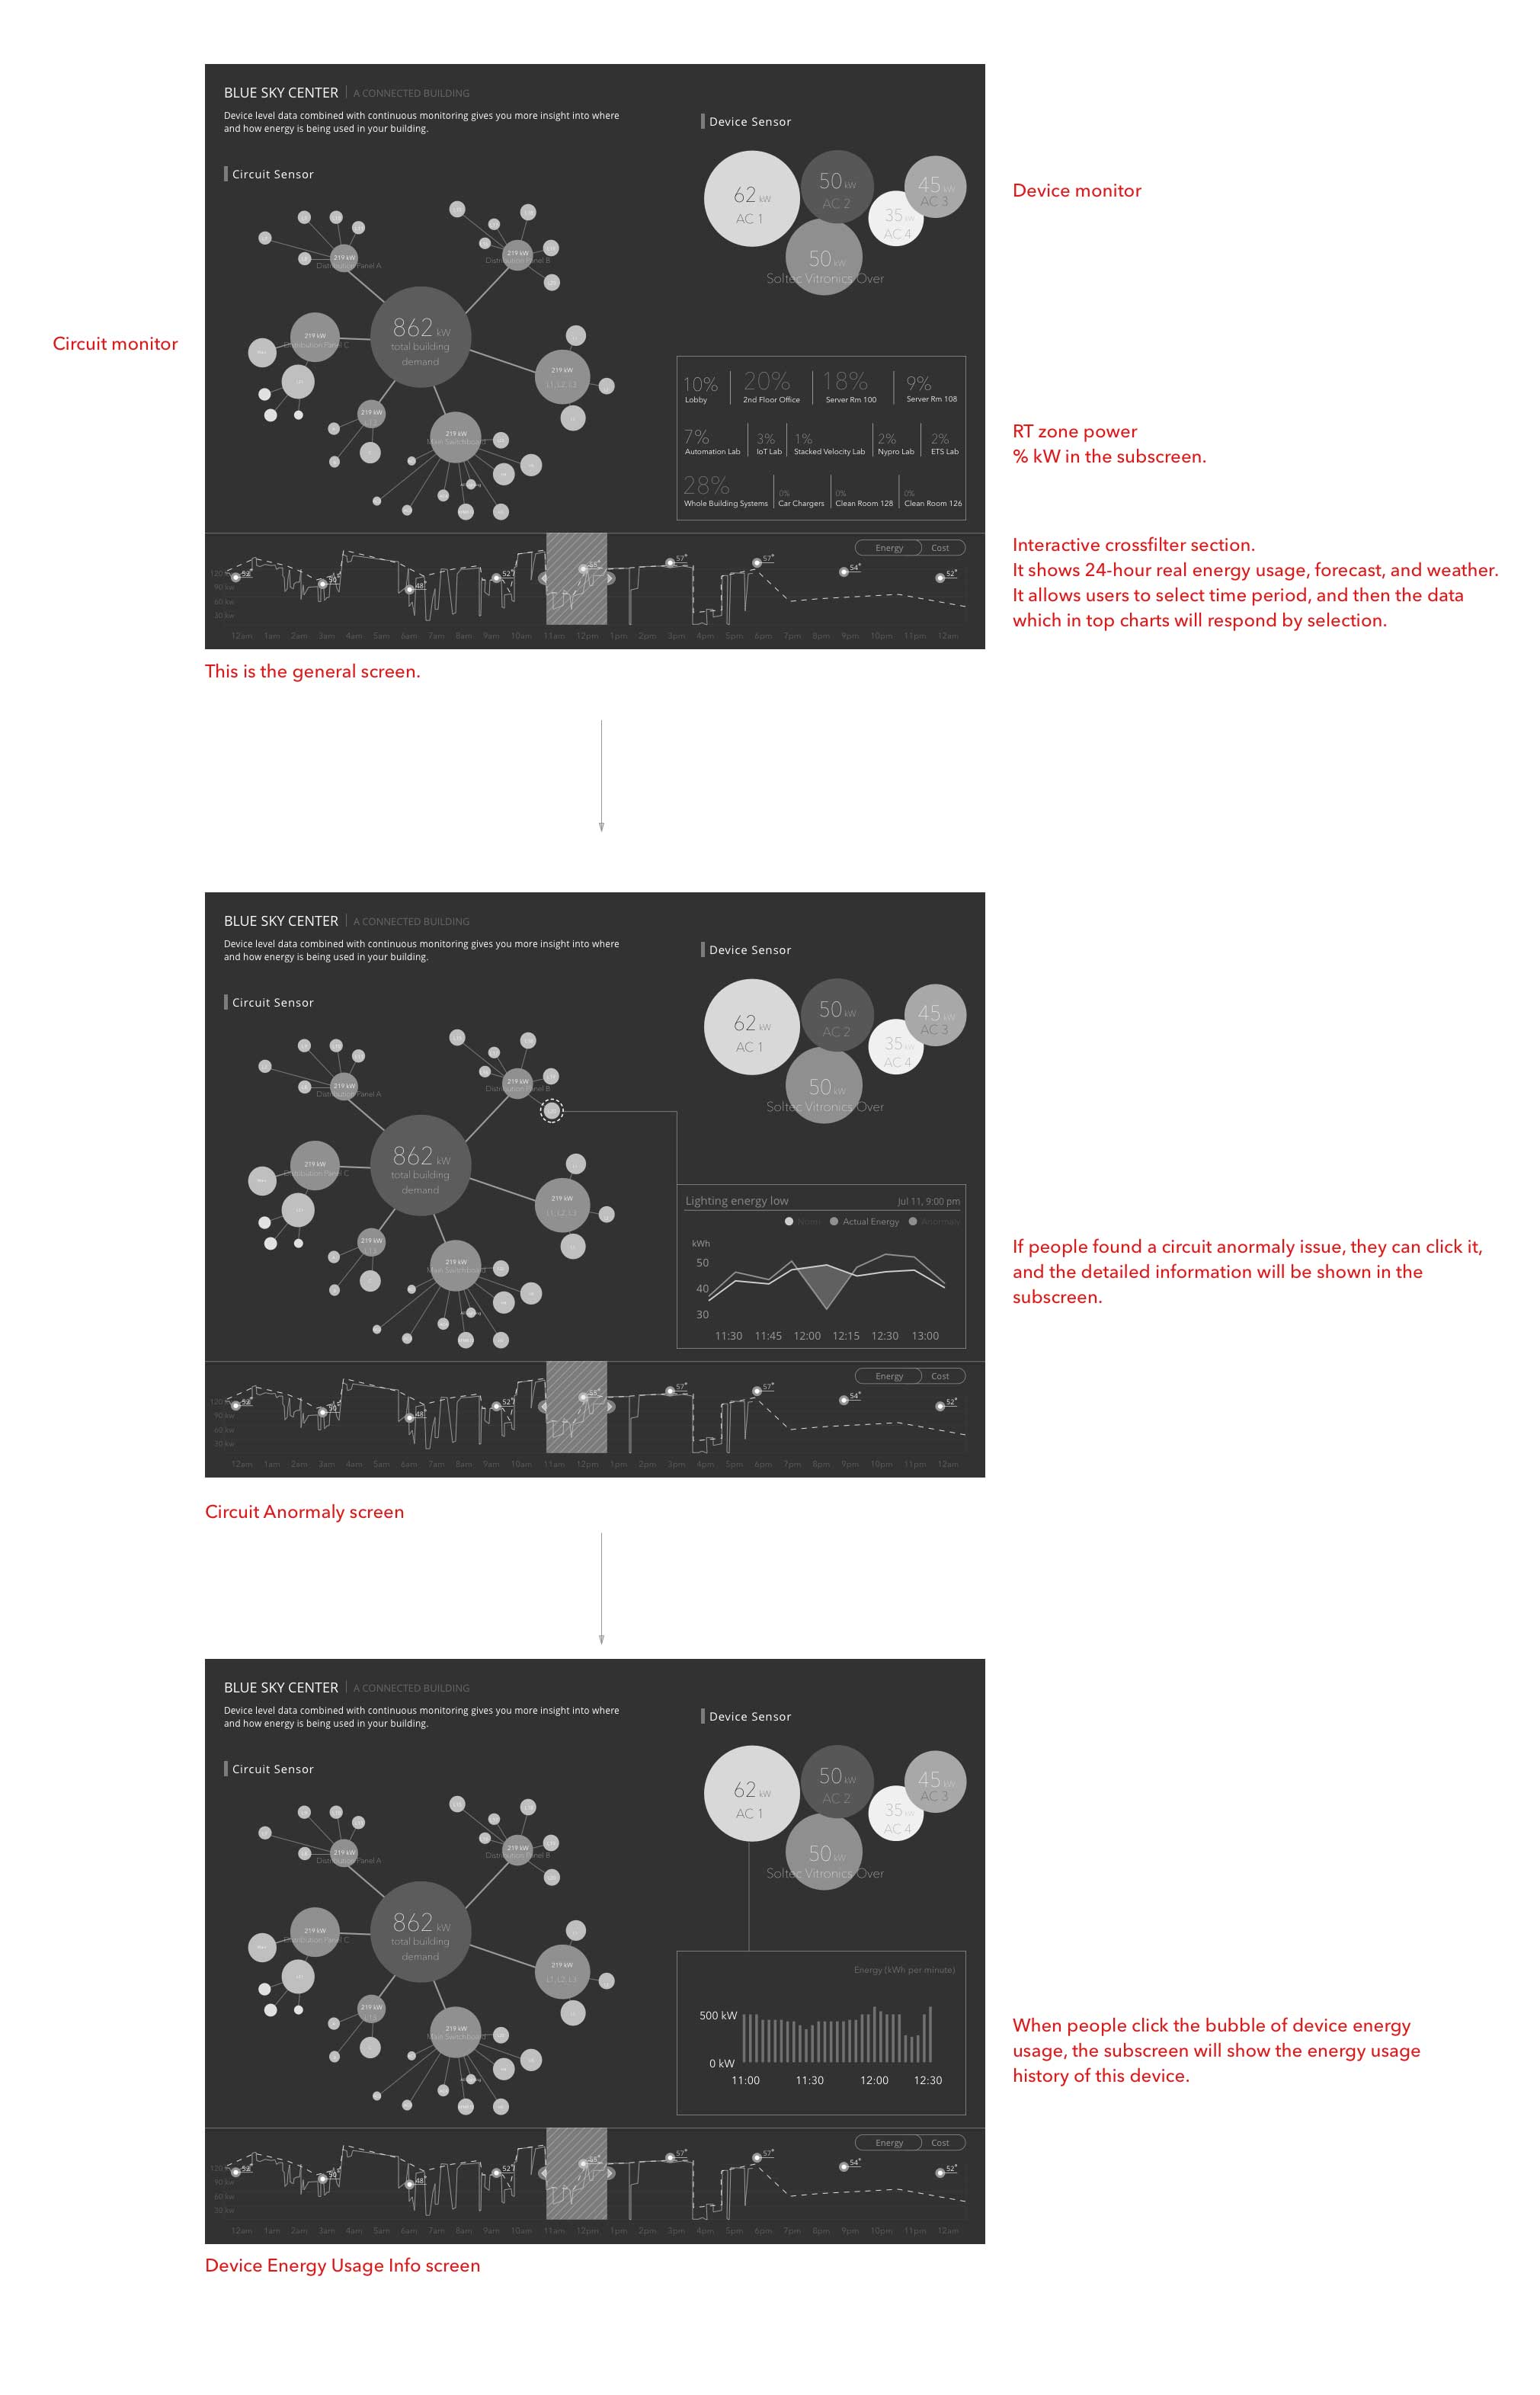
Design Requirements
Real time data updates.
Energy and power by zones (e.g., lobby, Lab 2, etc.).
Energy and power by end use (e.g., mechanical, lighting, etc.).
Forecasted power total (Optional).
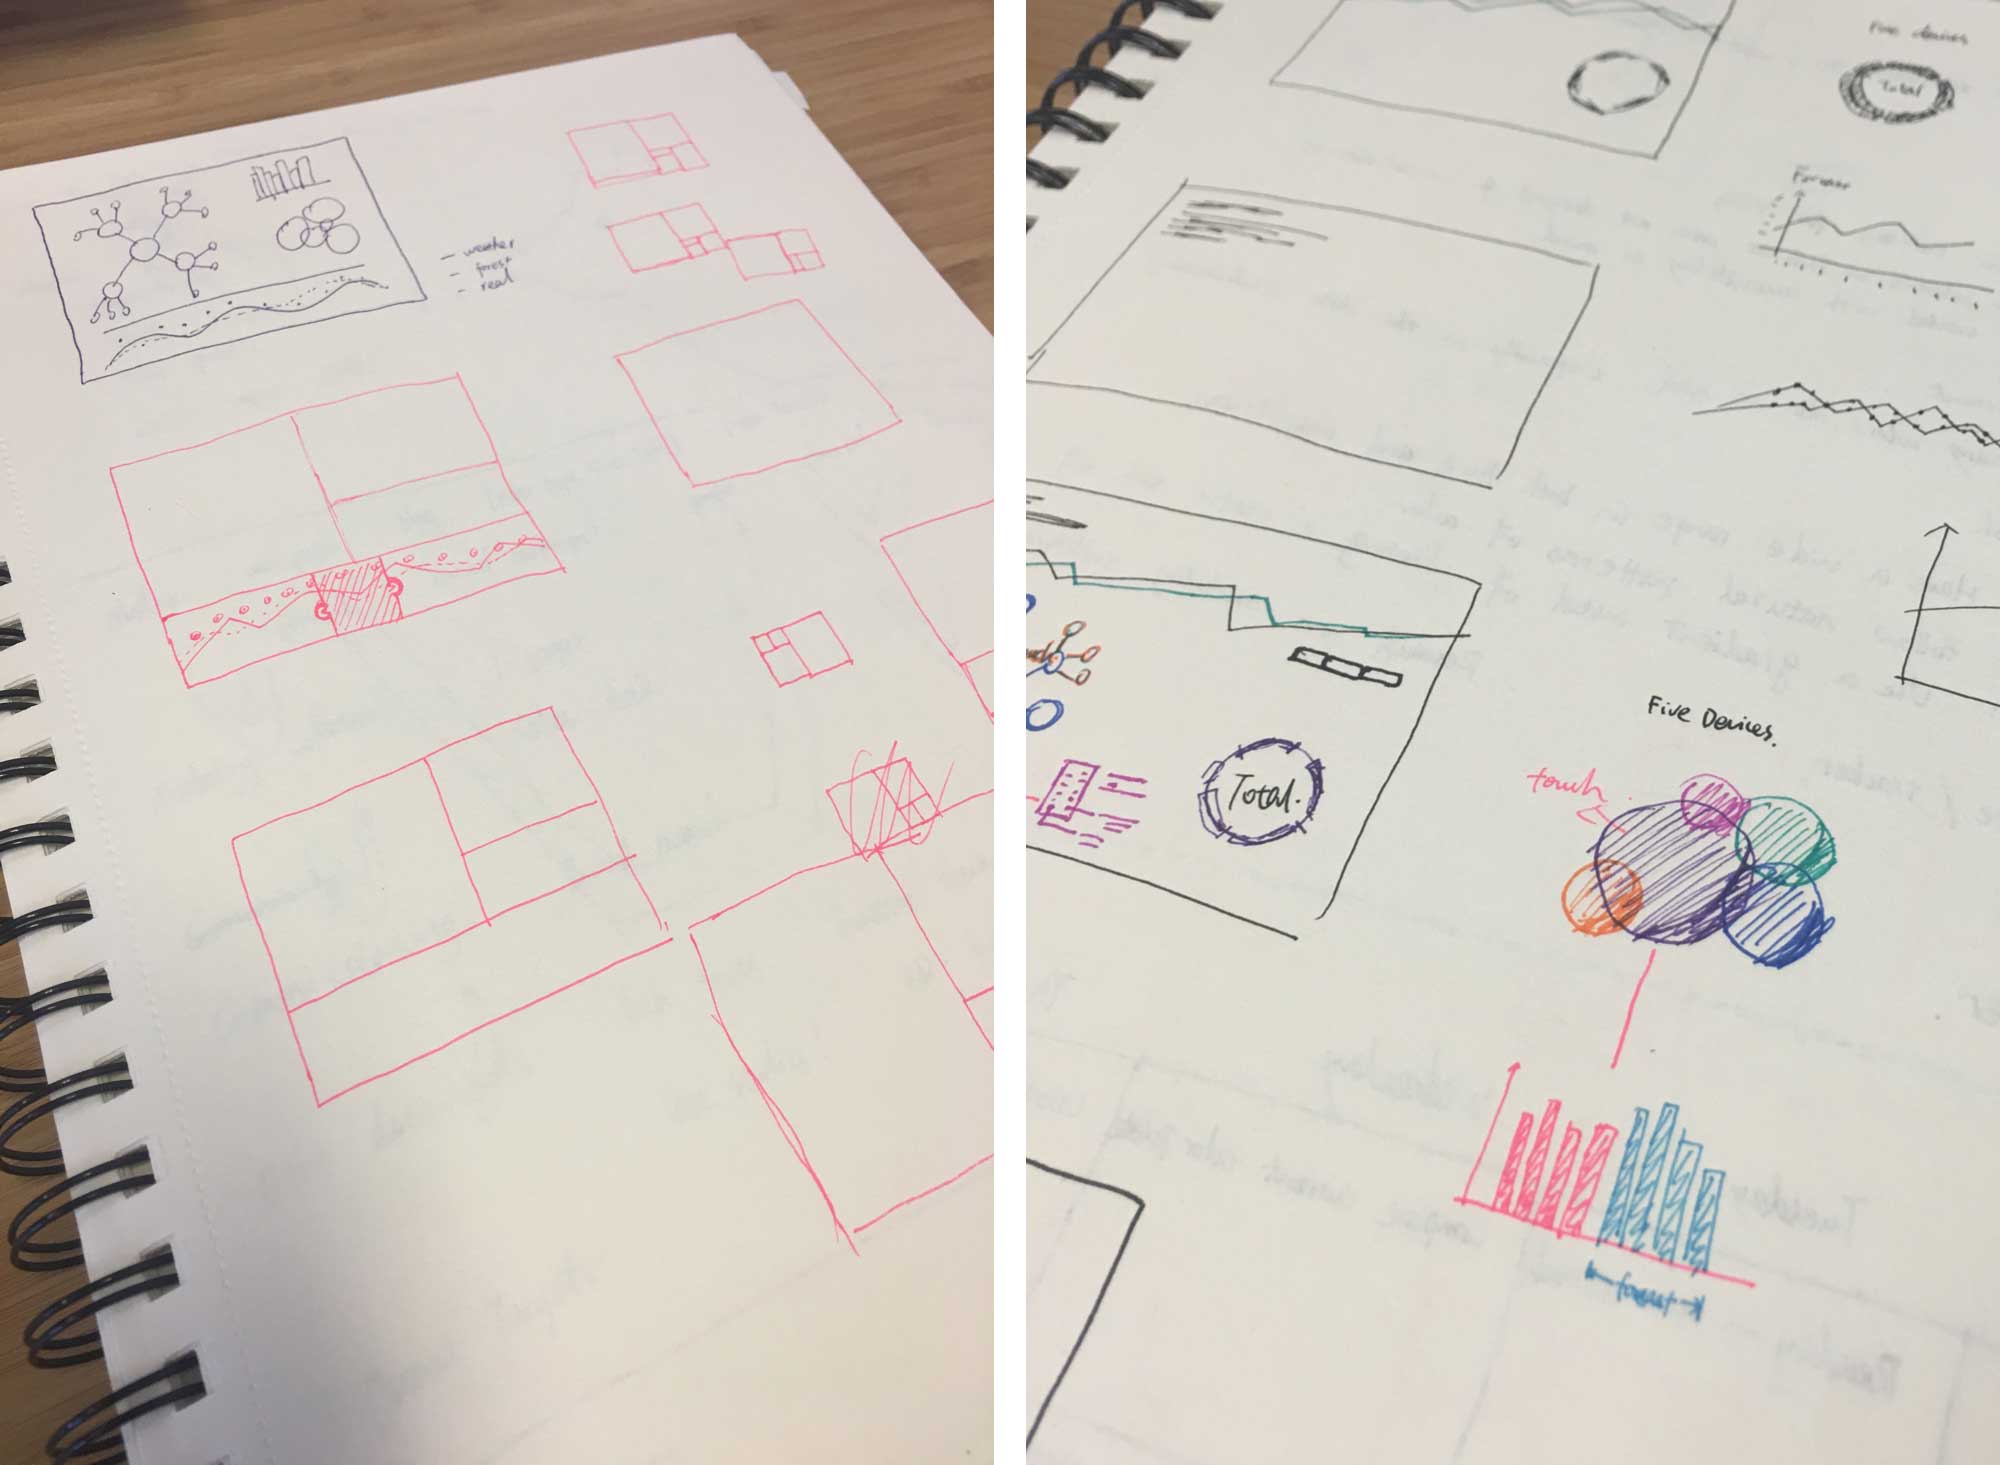
Sketches and B&W Prototype
My Role
Working with our Partnerships and Biz Dev manager, Front End Engineer, and UX Designer, I was responsible for Wireframing and Visual Design.