Made with by Daniela in San Francisco Bay Area, Califronia.
ADM Energy Report
A data visualization document design
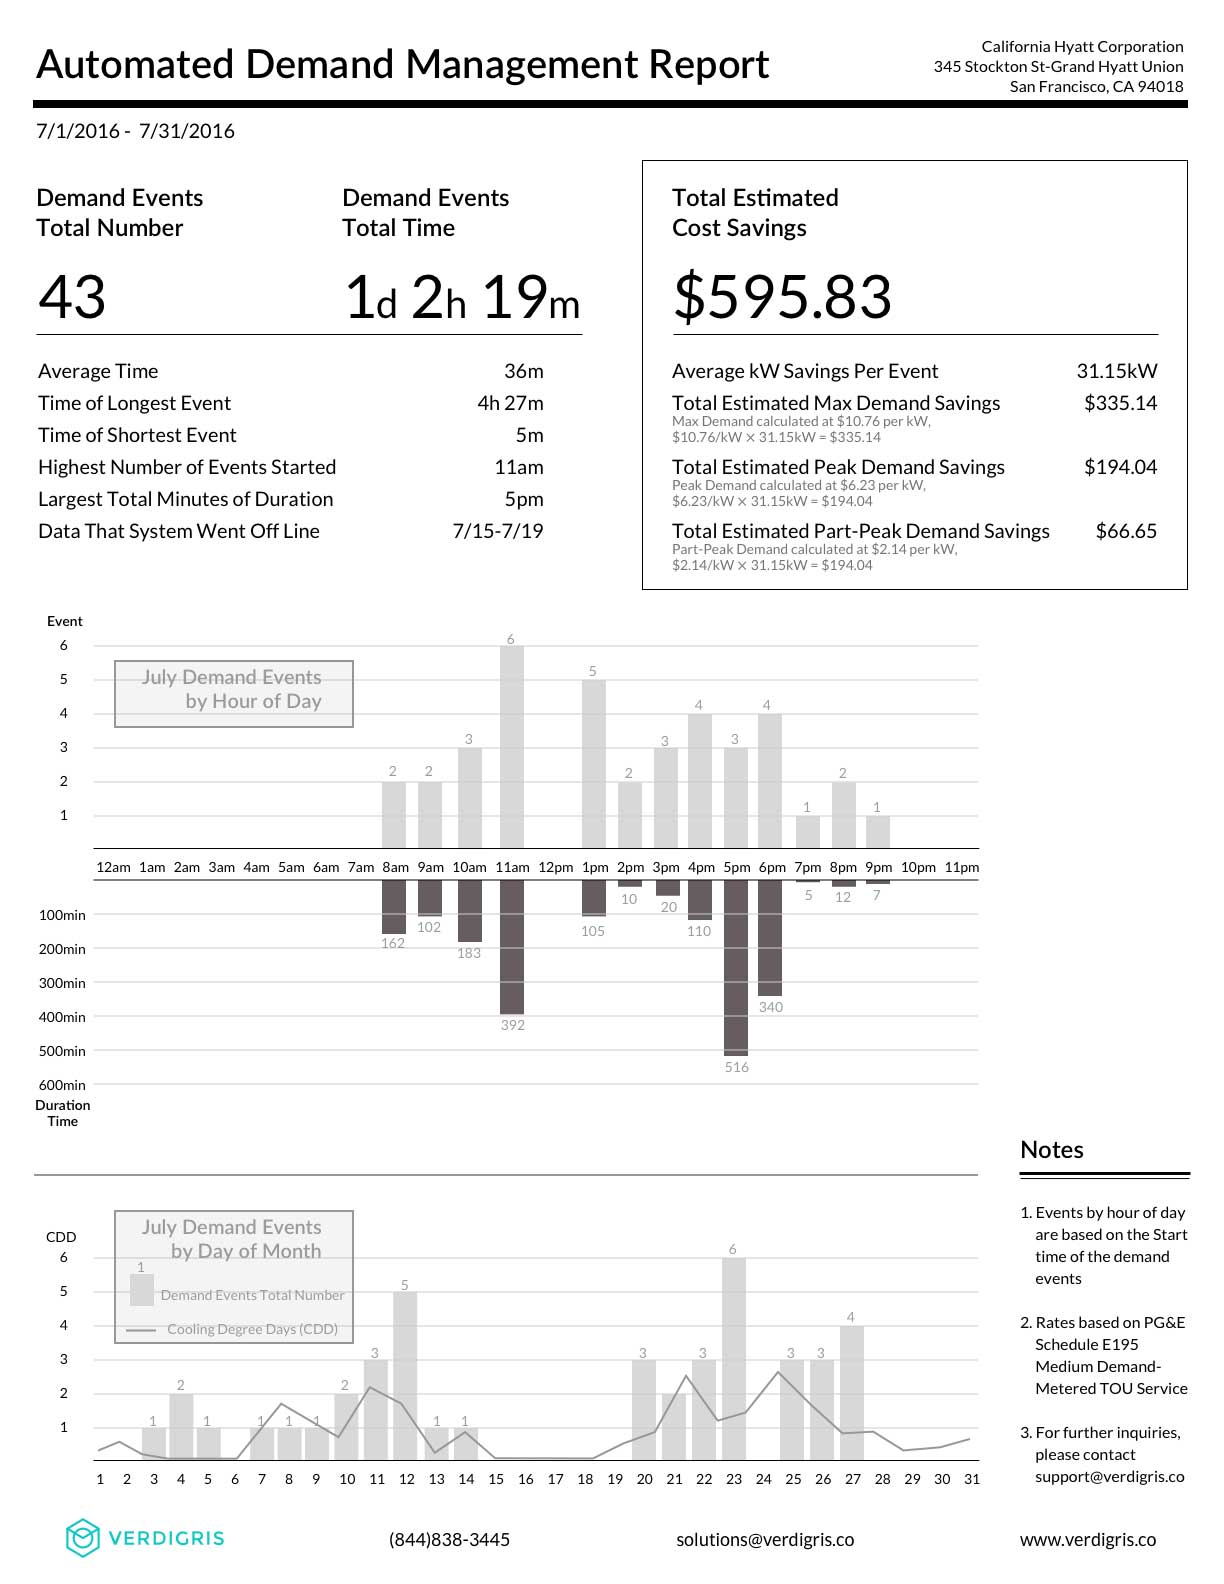
ADM should show you the demand (kW) reduction that corresponds to really savings in the energy bill and show the dollar amount of energy savings, to prove a ROI.
- Data Viz +
Challenge
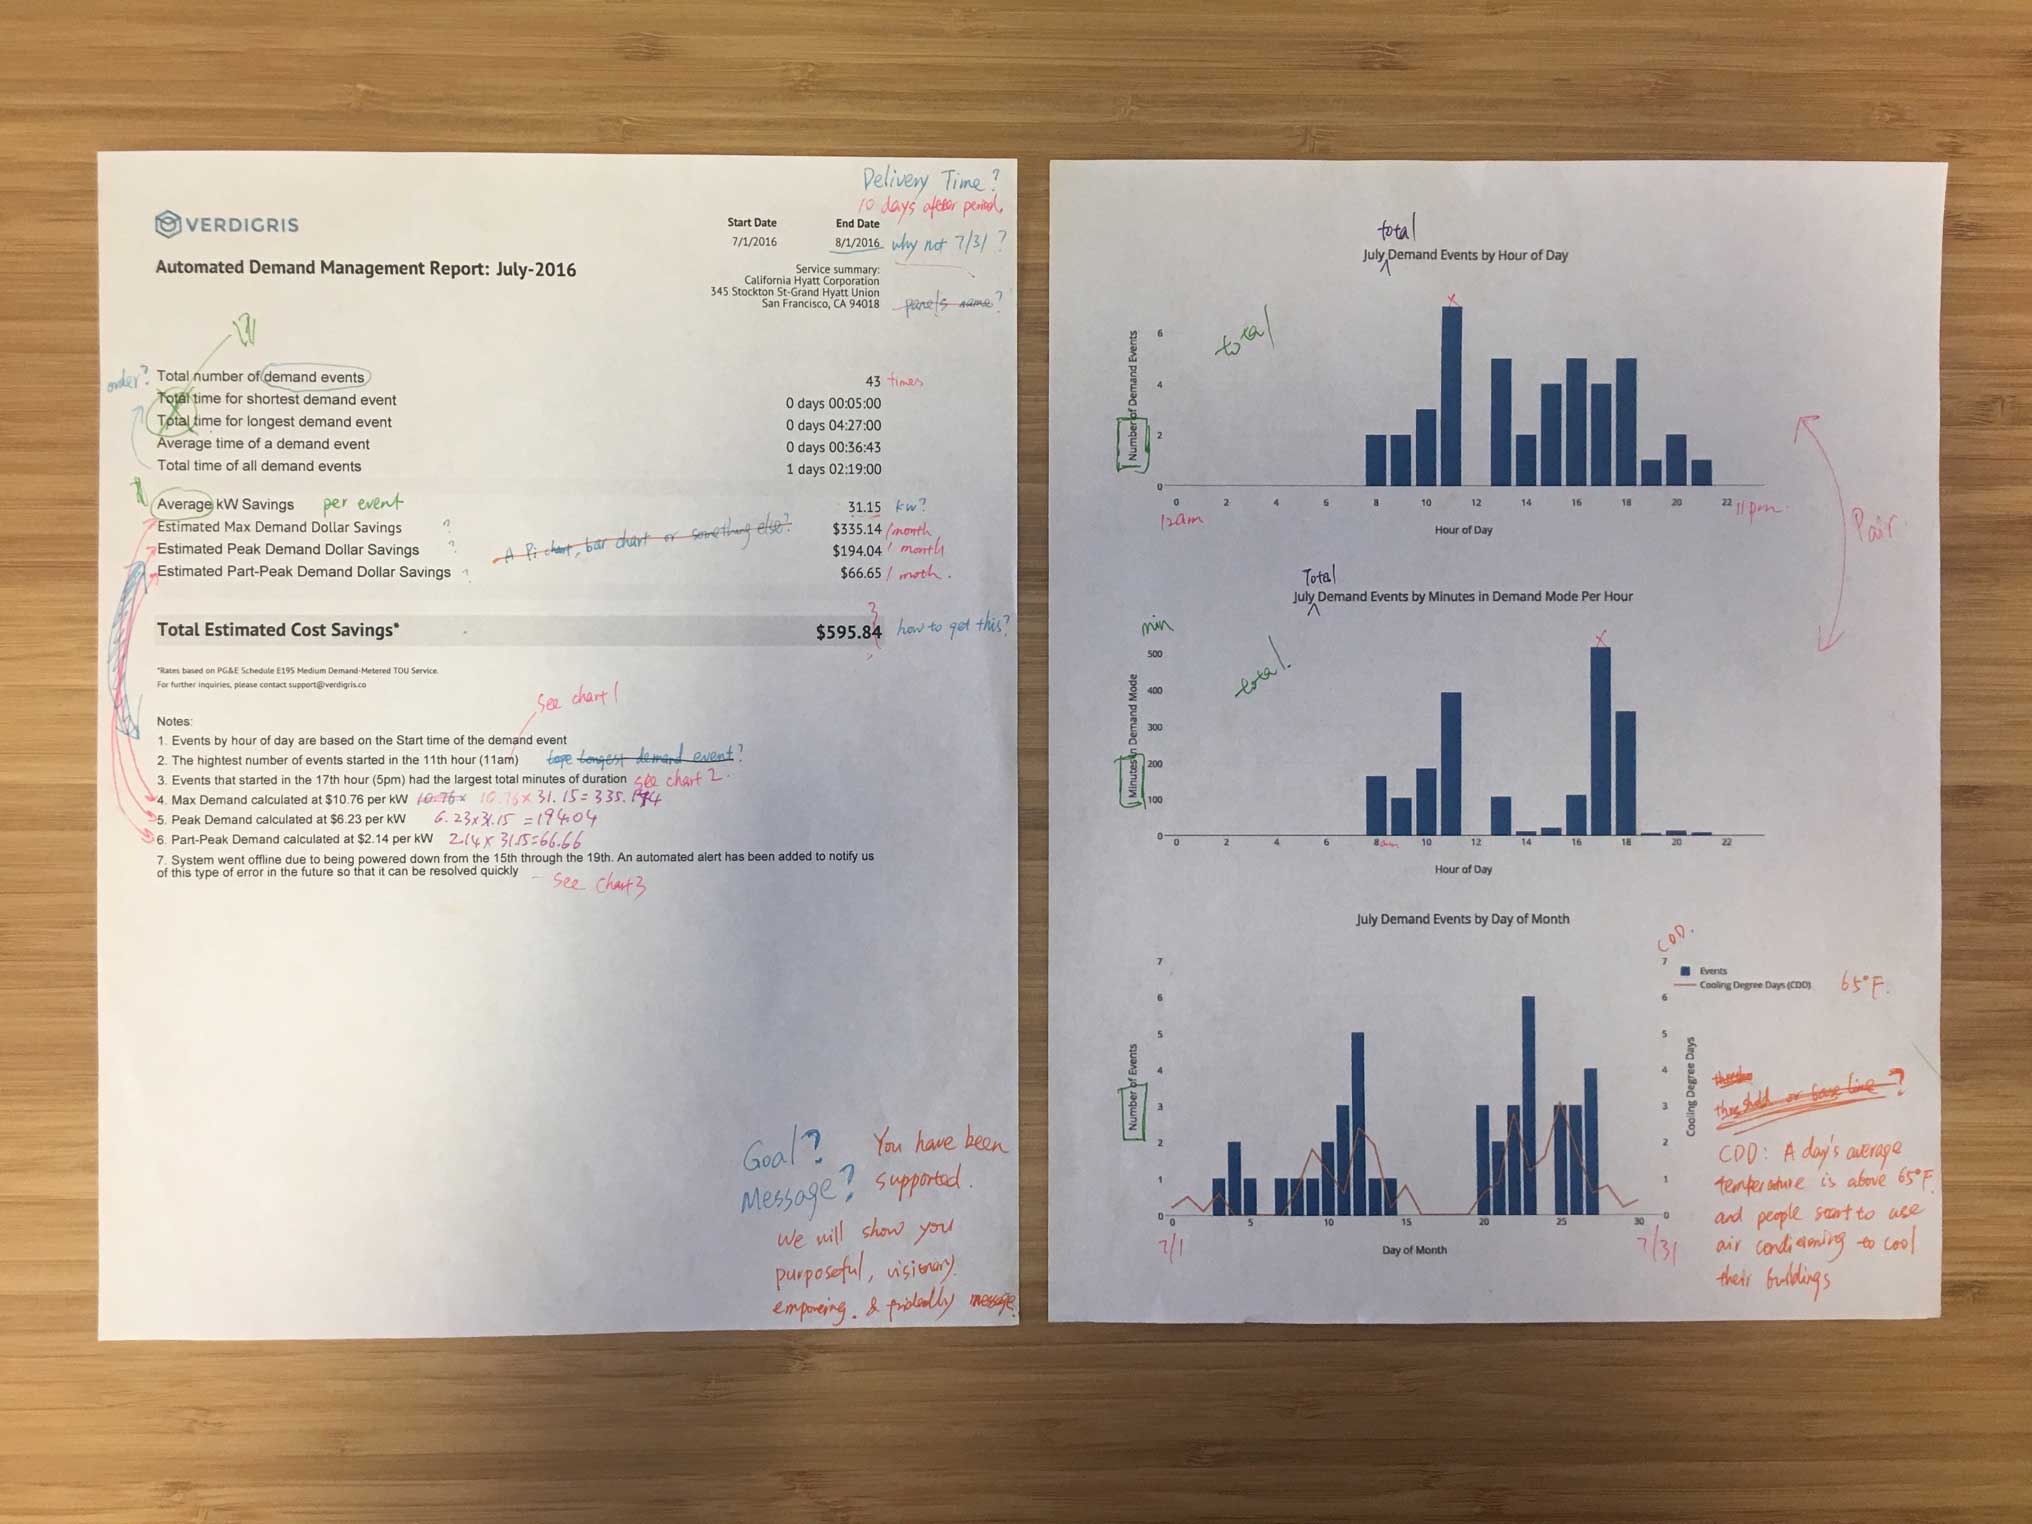
In Verdigris, the Customer Success team developed an Automated Demand Management Monthly Report for customers. The data gathereded from Verdigris system, Customer Success wanted to create this report in Google Sheets for their convenience.
The original form is a two-page document.
Sketches
I explored data visualization opportunties from sketches, the goal was to sumarized information to create a one-page report.
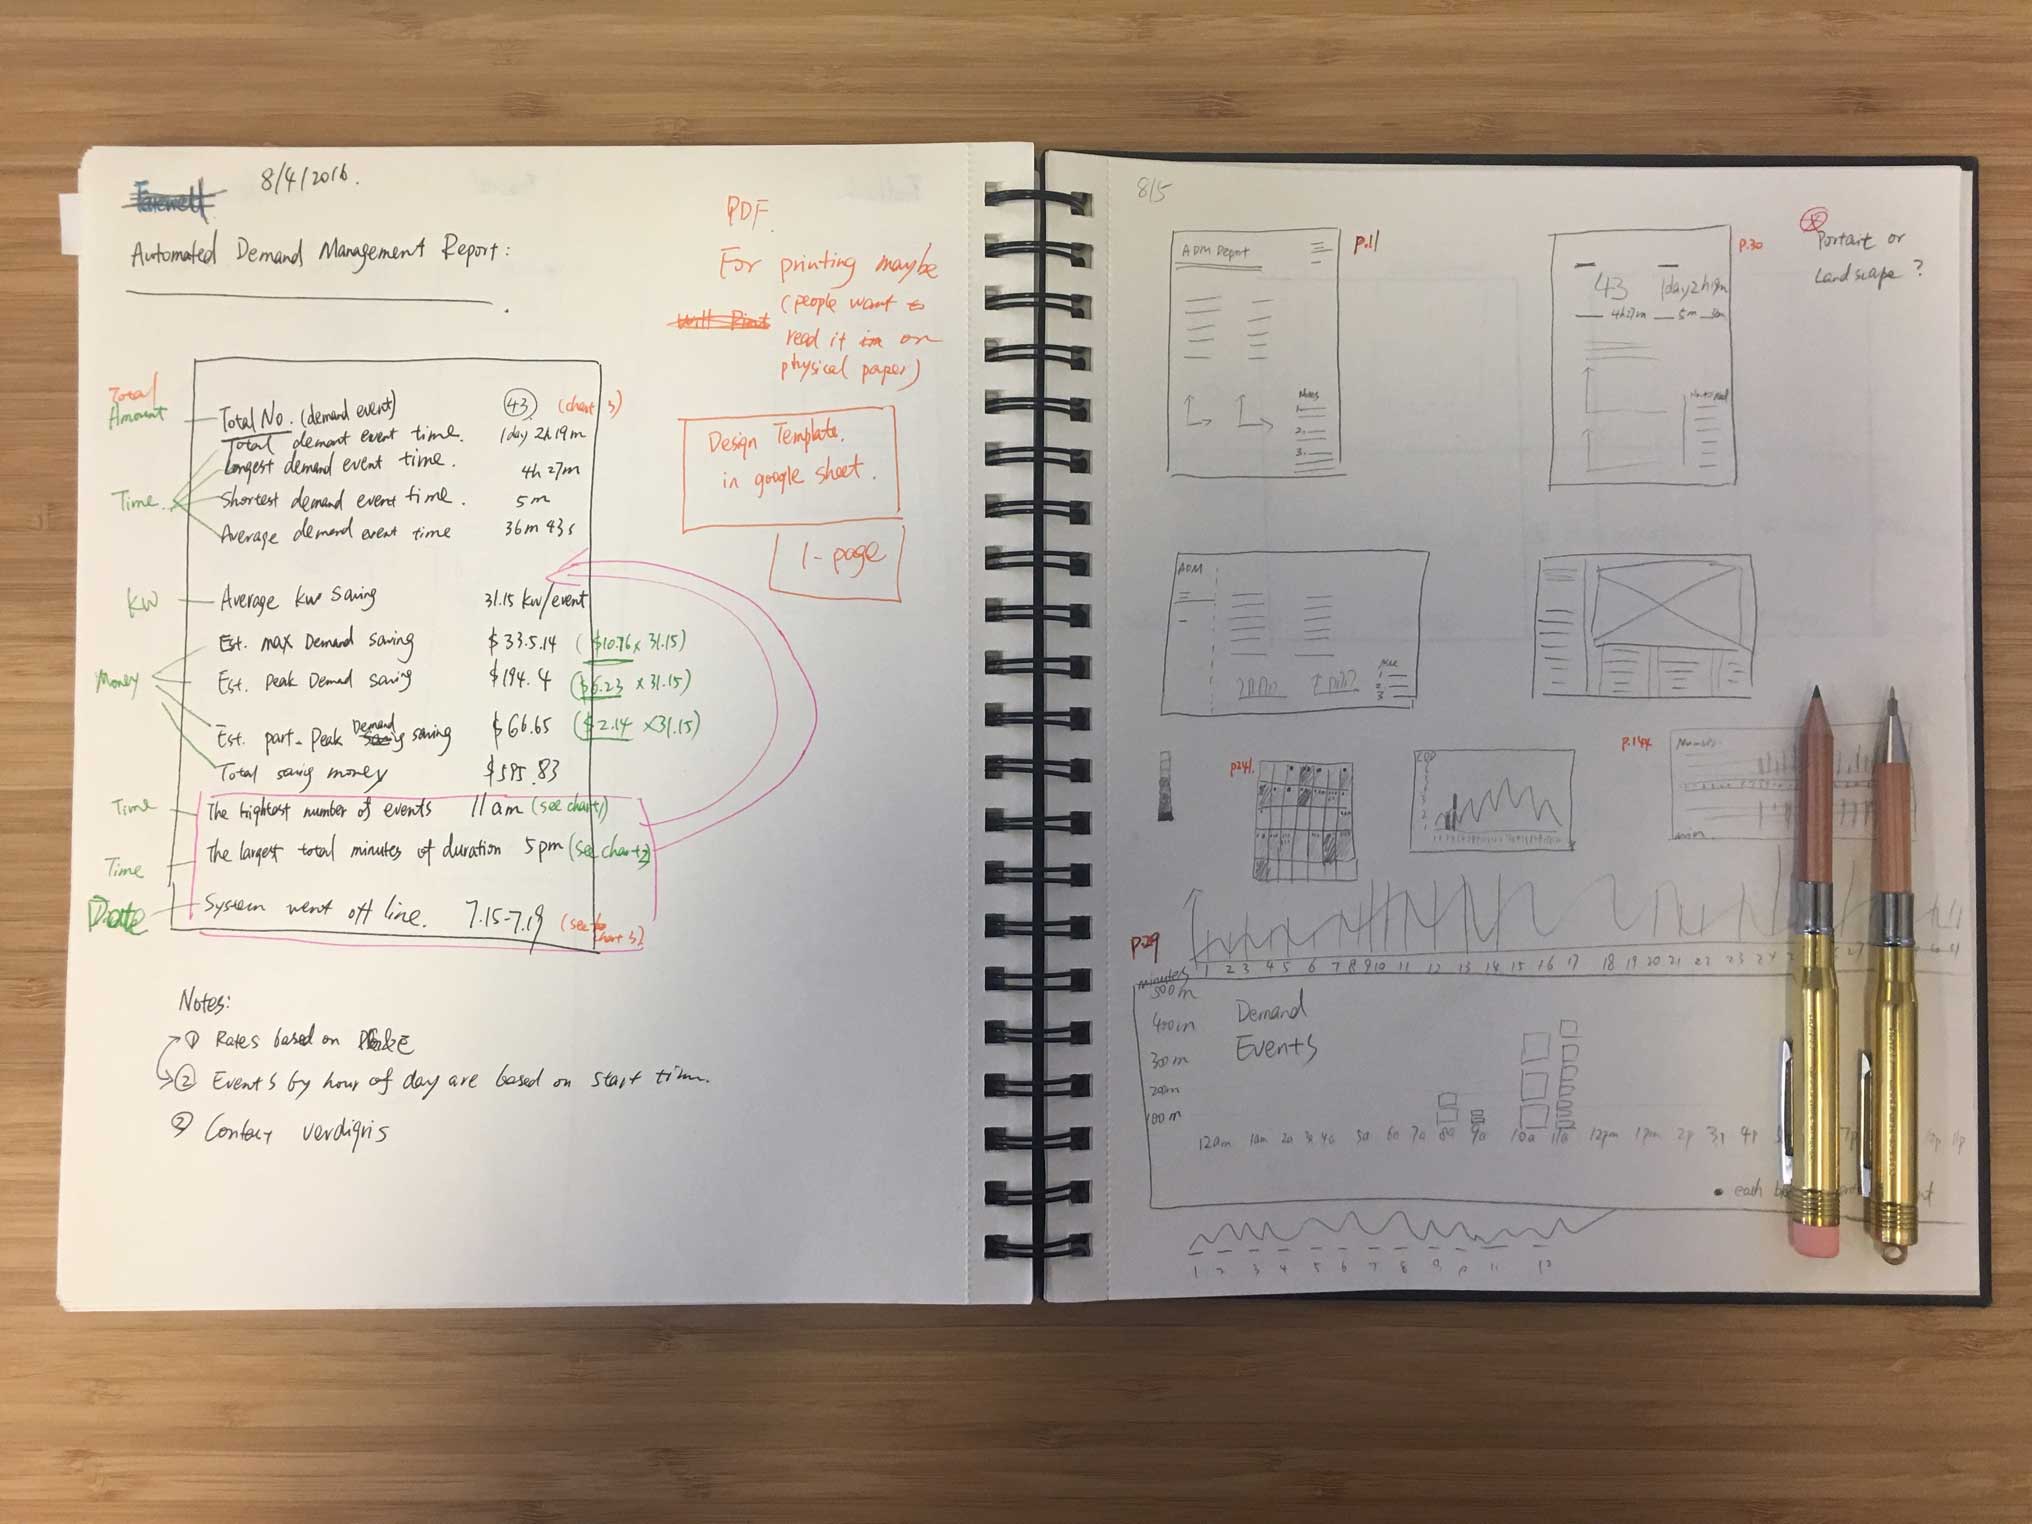
Came out a white and black mockup in Sketch.